
The Raff Channel indicator for MT4 uses a linear regression channel to map the current price movement into an upper boundary, lower boundary and central trend line.
The channel extremes can highlight areas where price is stretched, while the midline provides a simple reference for the prevailing direction.
This makes the tool useful for both trend-following and short-term reversal setups.
Price approaching an outer channel can attract attention for a potential reaction, while a sustained move beyond the boundary can signal that the existing trend is changing.
Why traders use the Raff Channel Indicator
The main attraction is its clear relationship between trend and price location.
The red midline shows the direction of the regression, while the upper and lower boundaries act as dynamic areas of resistance and support.
When the midline is rising, traders can concentrate on bullish opportunities near the lower channel.
When the midline is falling, attention can shift toward short setups near the upper channel.
This creates a practical framework for locating entries without relying on arbitrary horizontal levels.
Download This MT4 Indicator for Free
Indicator Chart Setup
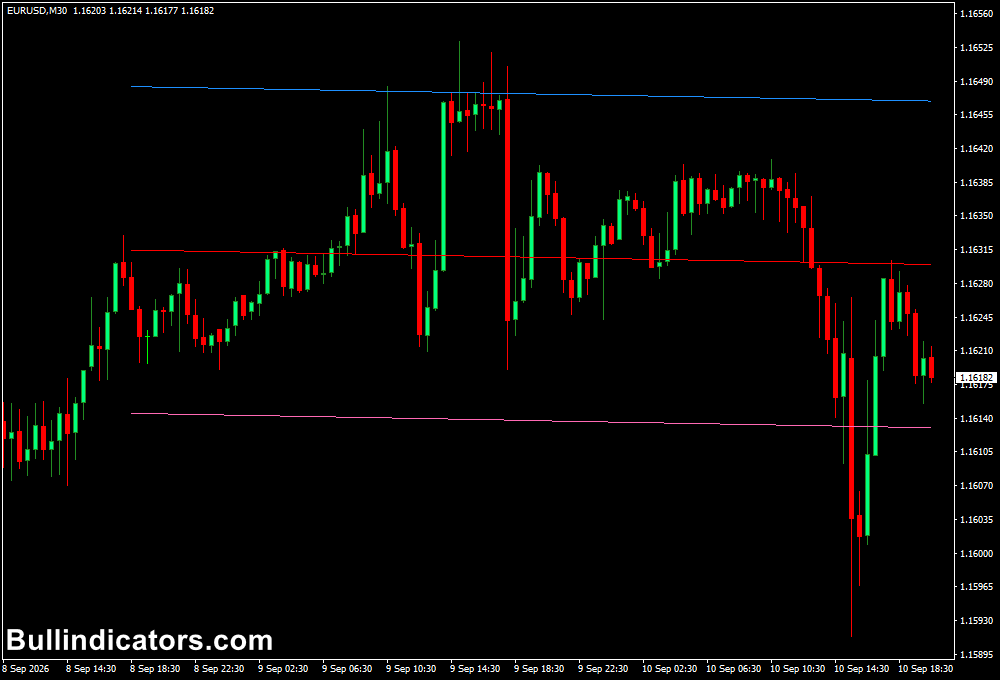
The Raff Channel is drawn directly over the price chart with three lines.
The blue upper line forms the upper channel boundary, the pink lower line marks the lower boundary, and the red center line represents the regression trend.
An upward-sloping red line indicates bullish conditions, while a downward-sloping line points to bearish conditions.
Price repeatedly reaching an outer boundary can produce potential reaction points.
A strong and sustained break outside the channel deserves attention because it may indicate that the current market structure is changing.
Core Features
- Linear regression-based price channel
- Upper and lower dynamic support and resistance levels
- Central regression line for directional analysis
- Clear visual identification of price extremes
- Suitable for intraday and higher-timeframe charts
- Useful for multi-timeframe analysis
Best for
- Trading pullbacks within established trends
- Identifying stretched price conditions
- Finding potential reversal zones
- Channel breakout observation
- Top-down multi-timeframe analysis
Best Markets
- Works across virtually all forex pairs available in MT4
- EURUSD and GBPUSD for liquid intraday trading
- USDJPY and EURJPY for active London and US sessions
- GBPJPY for larger intraday swings
- XAUUSD and major indices when the market is moving directionally
Trading Styles
- M1 and M5 scalping
- Intraday pullback trading
- Trend-following setups
- Channel reversal strategies
- Multi-timeframe swing analysis
How traders use it
A straightforward method is to establish the direction from the red regression line and then look for entries around the opposite channel boundary.
In a rising channel, a pullback toward the lower line can create a potential long setup. In a falling channel, a move toward the upper line can provide a potential short opportunity.
The channel can also be used across multiple timeframes.
A higher timeframe establishes the main directional bias, while a lower timeframe helps refine the entry around a channel extreme.
M1 Scalping Example: 5–15 Pips
The Raff Channel can be particularly useful for short-term scalping when volatility increases during the London and US sessions.
The objective is to trade channel reactions in the direction of the dominant short-term trend.
Trading Strategy Outline
- Choose an active forex pair such as EURUSD, GBPUSD, USDJPY or GBPJPY on the M1 chart.
- Confirm that the red midline is clearly rising or falling rather than moving sideways.
- For a bullish scalp, wait for price to pull back toward the lower channel boundary while the midline remains bullish.
- Look for bullish price confirmation around the lower line before entering the long position.
- For a bearish scalp, wait for price to move toward the upper channel boundary while the midline slopes downward.
- Look for bearish confirmation around the upper line before entering the short position.
- A realistic short-term objective can be around 5–15 pips, depending on the pair’s volatility and the current session conditions.
- Place the stop beyond the recent swing point or outside the channel structure, allowing the market enough room to fluctuate.
- A sustained breakout through the channel boundary can be a reason to avoid a reversal scalp and reassess the trend.
For example, during the London session, EURUSD may establish a rising M1 channel before pulling back to the pink lower boundary.
If bullish price action appears there while the red midline continues upward, the setup favors a quick long scalp toward the middle or upper portion of the channel.
The same principle applies in reverse for a bearish setup during the US session.
Get Instant Free Access
Indicator Settings
- Channel settings: Adjust the calculation parameters used to build the regression channel.
- Colors: Customize the upper, middle and lower channel line colors.
- Line Style: Adjust the visual presentation of the channel lines.
Important Notes
- The red midline should be used to establish the primary channel direction.
- Outer channel levels are more useful when price approaches them within a clear trend.
- A flat midline can indicate weak directional conditions and lower-quality setups.
- Do not automatically fade every move outside the channel; sustained breaks can signal a developing trend change.
- Higher-timeframe direction can be used to filter lower-timeframe entries.
- For M1 scalping, spreads, execution speed and session volatility can materially affect results.









