
The Spread indicator for MT5 is a practical trading tool that displays the current spread of a financial instrument directly on the chart.
The spread represents the difference between the bid and ask price and has a direct impact on trading costs, especially for short-term strategies where every pip matters.
The indicator continuously monitors spread changes and provides valuable information about market liquidity and execution conditions.
It can display the current spread value, allowing you to quickly determine whether the trading environment is suitable for opening positions.
This tool is particularly useful for scalpers and intraday traders who frequently enter and exit the market.
During volatile sessions, news releases, or periods of low liquidity, spreads can expand significantly and influence the outcome of a trade.
Why traders use the Spread Indicator
Understanding spread conditions is an important part of professional trade management.
A strategy may generate a good entry signal, but a wider spread can reduce potential profit or cause unnecessary losses, especially when trading small price movements.
The Spread Indicator helps identify periods when execution costs are favorable.
Scalpers can use it to avoid entering trades when spreads are temporarily higher than normal, while traders comparing different brokers can use it to monitor spread behavior across various market conditions.
The indicator is also valuable around major economic events.
Before announcements such as central bank decisions or employment reports, spreads may increase as liquidity providers adjust pricing.
Monitoring the spread can help you decide whether conditions are suitable for trading.
Download This MT5 Indicator for Free
Indicator Chart Setup
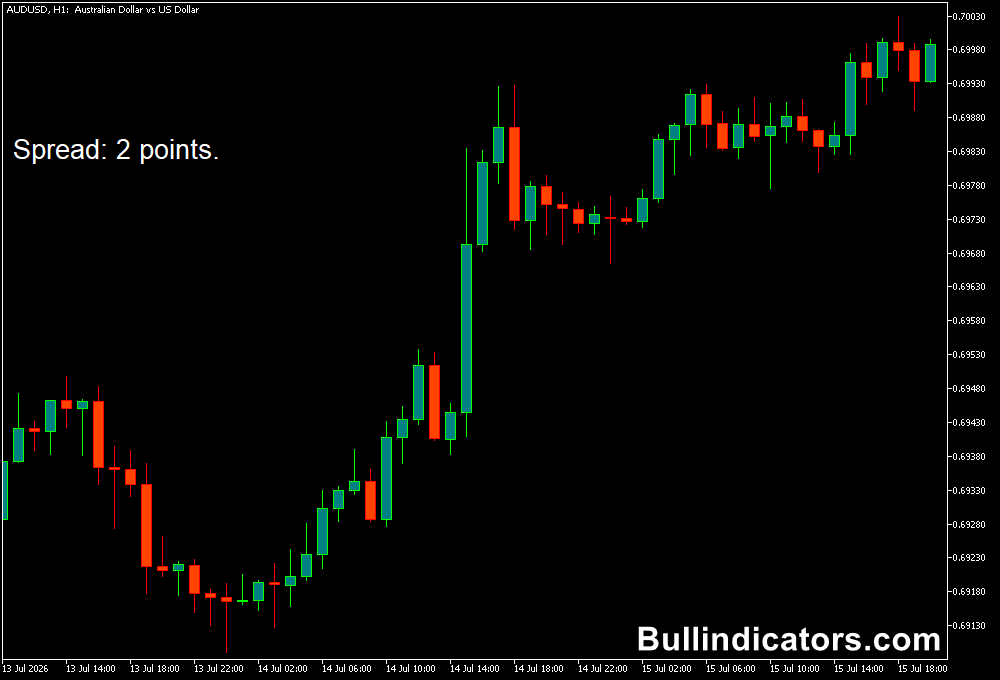
After attaching the indicator to an MT5 chart, a spread value appears directly on the trading screen.
The displayed number updates automatically as bid and ask prices change in real time.
For example, a spread value of 1.5 means the difference between the buying and selling price equals 1.5 points or pips depending on the broker’s pricing format.
The indicator allows you to monitor these changes without opening additional trading panels.
The spread display can be positioned in different areas of the chart and customized according to your preferred visual settings.
Core Features
- Real-time spread monitoring
- Displays current trading costs directly on the chart
- Useful for comparing market conditions
- Helps identify high-spread periods
- Customizable text appearance
- Alert functionality for spread changes
Best for
- Monitoring execution costs
- Scalping preparation
- Broker spread comparison
- News trading risk management
- Short-term trading decisions
Best Markets
- EUR/USD and other major Forex pairs with low spreads
- GBP/USD and USD/JPY during active trading sessions
- Gold (XAU/USD), where spreads can change quickly
- Major indices such as NAS100 and US30
- Currency pairs with higher average spreads that require monitoring
- Markets affected by liquidity changes and volatility spikes
Trading Styles
- Forex scalping
- Short-term intraday trading
- News event monitoring
- London and New York session strategies
- Algorithmic trading monitoring
- Broker execution analysis
How traders use it
The Spread Indicator is mainly used as a market condition filter.
Before entering a trade, you can check whether the current spread is within an acceptable range for your strategy.
For scalpers, this information is extremely valuable because trades often target small price movements.
A spread that suddenly increases can significantly reduce the potential reward of a setup.
Many scalpers prefer waiting until normal spread conditions return before opening positions.
For example, if EUR/USD normally shows a spread of 0.8 pips but increases to 3 pips during a low-liquidity period, a scalper may decide to wait until the spread narrows again before entering.
A simple trading approach is:
- Check that the spread is at its normal or minimum level.
- Wait for confirmation from your trading strategy.
- Enter the position after the confirmation signal appears.
- Place a stop loss according to your risk management rules.
- Monitor spread conditions during active trades.
The indicator is less important for swing traders who hold positions for several days or weeks and analyze H1, H4, or Daily charts.
For these traders, the spread usually represents a smaller percentage of the overall price movement.
However, it can still be useful when entering trades during volatile periods or trading instruments with naturally wider spreads.
For scalping and lower timeframe strategies such as M1, M5, and M15 trading, monitoring spread conditions can have a much greater impact on trade quality.
Get Instant Free Access
Indicator Settings
- Font Color: Changes the color of the spread information displayed on the chart.
- Font Size: Adjusts the size of the spread text for better visibility.
- Font Face: Allows you to select the preferred font style.
- Corner: Selects the chart location where the spread information will appear.
- Alerts System: Enables notifications when spread conditions meet the selected alert criteria.
Important Notes
- The spread changes continuously depending on liquidity and market volatility.
- Spreads often increase during major economic announcements.
- The indicator measures trading costs and does not generate buy or sell signals.
- Scalpers benefit the most because transaction costs have a larger impact on short trades.
- Combine spread monitoring with a complete trading strategy for better decision-making.









