
The Better Volume indicator for MT5 is an advanced volume analysis tool designed to measure market activity and identify changes in trading participation.
Volume plays an important role in financial markets because it can reveal the strength behind price movements and provide additional information about market sentiment.
Since the Forex market does not provide centralized exchange volume data, the indicator uses tick volume to analyze the number of price changes during a specific period.
By studying these volume changes, you can better understand whether a price move is supported by strong market participation or if momentum is weakening.
The indicator displays volume activity through a color-coded histogram, making it easier to recognize different market conditions.
It can help identify periods of increasing buying or selling pressure, low participation, and possible momentum shifts.
Why traders use the Better Volume Indicator
Price movement alone does not always reveal the complete market picture.
A strong candle supported by high activity often carries more significance than a similar move with weak participation.
The Better Volume Indicator helps analyze this difference by categorizing volume strength directly on the MT5 chart.
The color-based histogram allows you to quickly identify changes in market activity.
Increased buying or selling volume can indicate that larger market participants are becoming active, while low-volume periods may suggest uncertainty or reduced momentum.
The indicator also includes a moving average applied to the volume histogram, providing another reference point for comparing current activity with previous market conditions.
Download This MT5 Indicator for Free
Indicator Chart Setup
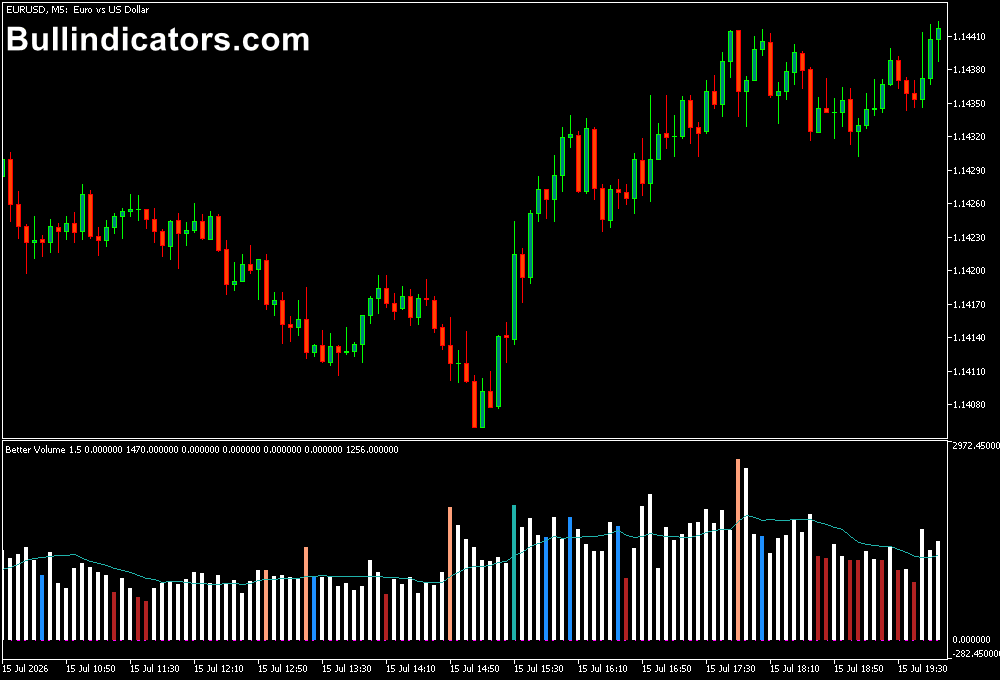
After applying the Better Volume Indicator to an MT5 chart, a histogram appears in a separate window below the price chart.
Each volume bar is displayed with a different color depending on the type and strength of market activity.
White bars represent normal volume activity, while red bars highlight lower participation periods.
Blue bars indicate increased activity that may require additional confirmation because strong volume does not always reveal the immediate market direction.
Trading volume signals are displayed through specific colors.
SeaGreen bars indicate stronger buying activity, while orange bars suggest increased selling pressure.
These signals can be combined with trend analysis and price action to find higher-quality setups.
Core Features
- Advanced tick volume analysis
- Color-coded volume histogram
- Identifies buying and selling activity
- Includes volume moving average calculation
- Helps detect momentum changes
- Alert notifications when volume colors change
Best for
- Volume-based market analysis
- Momentum confirmation
- Breakout validation
- Trend strength evaluation
- Finding potential exhaustion areas
Best Markets
- Major Forex pairs during active London and New York sessions
- EUR/USD, GBP/USD, and USD/JPY for volume-based momentum analysis
- Gold (XAU/USD), where volume changes often accompany strong price movements
- US indices such as NAS100 and S&P 500 during high-volatility periods
- Crude oil and other commodities affected by strong market participation
- Liquid cryptocurrency pairs where sudden volume increases can signal momentum shifts
Trading Styles
- Trend following
- Breakout trading
- Intraday momentum strategies
- Scalping with volume confirmation
- Swing trading
- Price action analysis
How traders use it
The Better Volume Indicator is mainly used as a confirmation tool.
A volume increase by itself does not determine whether price will rise or fall, but it can show that market participation is increasing around an important price area.
For example, during an uptrend, a strong SeaGreen volume bar appearing after a pullback may indicate renewed buying interest.
This can be used as confirmation before entering a long position.
A stop loss can be placed below the recent swing low, while profit targets can be based on previous resistance levels.
For short setups, increasing orange volume during a bearish move can suggest stronger selling pressure.
When this occurs near resistance or after a failed breakout, it may provide confirmation for a sell entry.
Example: Combining Better Volume for Accurate Entries and Exits
A practical approach is combining the Better Volume Indicator with trend analysis and a technical entry tool.
For example, imagine EUR/USD is trading above the 100 SMA, showing a bullish market environment.
Price makes a temporary pullback toward support, and the Better Volume Indicator shows increasing SeaGreen volume as buyers return.
This combination suggests that the pullback may be ending and that the main trend could continue.
A buy entry can be considered after a bullish candle confirmation.
The stop loss can be positioned below the support area, while the exit can be managed when selling volume increases or when price reaches a previous resistance zone.
The opposite method can be applied in bearish conditions.
If price remains below the 100 SMA, reaches resistance, and the Better Volume Indicator displays increasing orange volume, it may indicate that sellers are gaining control.
A short position can be considered after confirmation, with an exit when buying volume starts increasing or when the next support level is reached.
The indicator can also help avoid poor trading conditions.
When red low-volume bars dominate the chart, market participation may be limited, making it harder to identify reliable setups.
Get Instant Free Access
Indicator Settings
- MAPeriod: Determines the period of the moving average displayed with the volume histogram. Higher values create a smoother reference line.
- LookBack: Controls the number of previous ticks used for volume calculations. Increasing this value provides a broader volume analysis.
- Width1: Adjusts the thickness of histogram columns displayed in the indicator window.
- AlertOnColorChange: Enables or disables alerts when histogram colors change.
- Push Alerts: Sends volume change notifications to your mobile device.
- Email Alerts: Sends notifications through email when important volume changes occur.
Important Notes
- Volume signals should always be evaluated together with price direction and market structure.
- High volume does not automatically mean price will continue in the same direction.
- Low-volume conditions can indicate periods where waiting is preferable.
- The indicator is most effective when combined with trend filters or support and resistance analysis.
- Tick volume represents market activity and not the exact centralized Forex trading volume.









