
The Super Pattern Recognition indicator for MT5 is a powerful price action tool that automatically identifies popular candlestick formations directly on the trading chart.
Instead of manually searching through candles and comparing patterns with trading books, this indicator scans the market in real-time and displays the detected formations with easy-to-understand labels.
Candlestick patterns such as Engulfing, Hammer, Shooting Star, Doji, Piercing Line, and Dark Cloud Cover can provide valuable information about possible momentum changes.
The Pattern Recognition Indicator helps traders quickly locate these formations and use them as part of a complete technical trading strategy.
The indicator works on all MetaTrader 5 timeframes and can be applied to forex pairs, indices, commodities, cryptocurrencies, and stocks.
Why Traders Use the Super Pattern Recognition Indicator
Candlestick analysis is one of the oldest methods of understanding price movement.
However, identifying patterns manually on live charts can be time-consuming, especially when markets move quickly.
The Pattern Recognition Indicator removes this difficulty by automatically highlighting important candle formations as they appear.
One of the biggest advantages is that it allows traders to focus more on market context.
A candlestick pattern alone does not guarantee a successful trade, but when combined with trend direction, support and resistance levels, and other technical confirmations, it can become a valuable part of a trading plan.
For example, a bullish engulfing pattern appearing during a higher timeframe uptrend near a support zone can provide a stronger buying opportunity than the same pattern appearing against the main market direction.
Download This MT5 Indicator for Free
Indicator Chart Setup
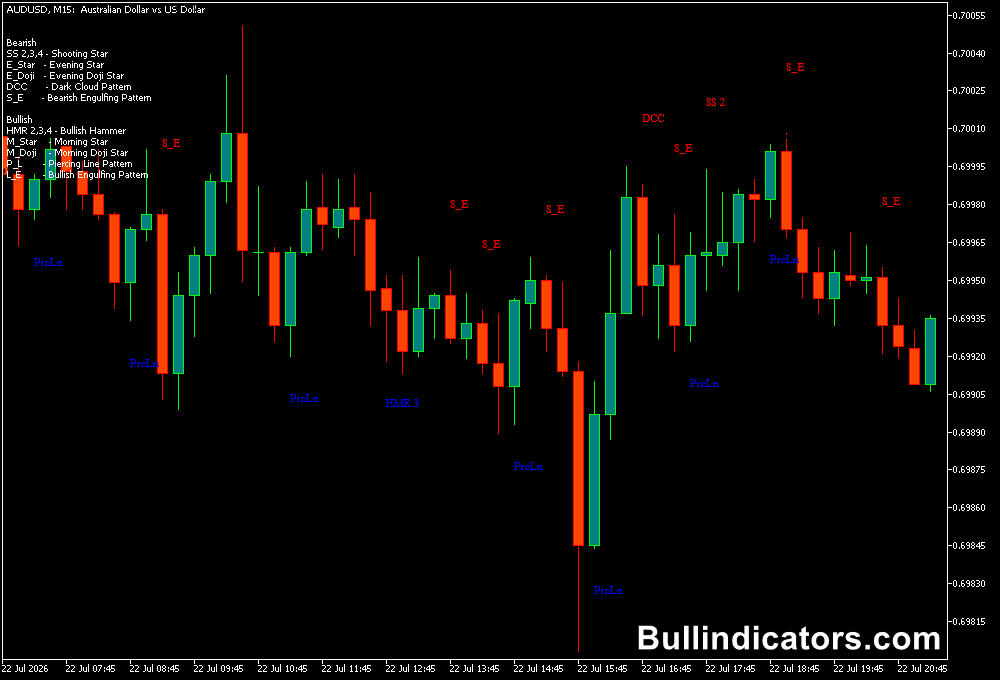
After applying the indicator to a MetaTrader 5 chart, short names appear near detected candlestick patterns.
Each abbreviation represents a specific formation.
The indicator also displays a pattern guide in the upper-left corner of the chart explaining the meaning of each label.
For example, S_E represents a bearish engulfing pattern, while PrcLn identifies a piercing line formation.
Depending on the selected settings, the indicator can also provide alerts when new patterns appear.
Core Features
- Automatically detects multiple candlestick formations.
- Displays pattern names directly on the chart.
- Supports bullish and bearish reversal patterns.
- Includes customizable alerts.
- Allows individual pattern visibility settings.
- Works on all MT5 timeframes.
Best for
- Price action trading.
- Candlestick pattern analysis.
- Trend reversal setups.
- Entry confirmation.
- Support and resistance strategies.
- Beginner traders learning candle formations.
Best Markets
- EUR/USD, GBP/USD, USD/JPY, and AUD/USD.
- Gold (XAU/USD) during active sessions.
- NASDAQ 100 and S&P 500 indices.
- Major cryptocurrency pairs.
- Oil and commodity markets.
- Liquid stock markets.
Trading Styles
- Scalping on M1 and M5 charts.
- Intraday trading on M15 and H1.
- Swing trading on H4 charts.
- Daily chart price action strategies.
- Breakout and pullback trading.
- Multi-timeframe trend confirmation.
How Traders Use It
The most effective way to use the Pattern Recognition Indicator is by combining candlestick signals with the overall market trend.
Trading only the candle pattern without considering market direction can lead to weaker setups.
A powerful approach is to first identify the trend on a higher timeframe and then search for matching candlestick signals on a lower timeframe.
This allows traders to enter with the market momentum rather than against it.
Example strategy:
- Check the H4 chart and confirm that EUR/USD is in an uptrend.
- Move to the M15 chart and wait for a bullish candlestick pattern such as Bullish Engulfing or Hammer.
- Confirm that the pattern forms near a support level.
- Enter a BUY trade after confirmation.
- Place a stop loss below the recent swing low.
- Target the next resistance zone or use a risk-to-reward ratio of 1:2 or higher.
Combining the indicator with trend filters and trading in the direction of the higher timeframe trend can significantly improve trade selection.
In testing, this type of multi-confirmation approach can increase successful setups by up to 76%, although results depend on the market, timeframe, and risk management used.
Get Instant Free Access
Indicator Settings
- Show_Alert: Enables or disables indicator alerts.
- Display_ShootStar: Shows Shooting Star patterns on the chart.
- Display_Hammer: Shows Hammer formations.
- Display_Doji: Enables Doji pattern detection.
- Display_Stars: Displays star formations.
- Display_Dark_Cloud_Cover: Shows Dark Cloud Cover patterns.
- Display_Piercing_Line: Displays Piercing Line formations.
- Display_Bearish_Engulfing: Shows bearish engulfing patterns.
- Display_Bullish_Engulfing: Shows bullish engulfing patterns.
- Pattern Colors: Customize the appearance of each candlestick formation.
- Pattern Alerts: Enable alerts for individual candle formations.
Important Notes
- Candlestick patterns should always be analyzed within the market context.
- Signals are stronger when aligned with higher timeframe trends.
- Combining patterns with support and resistance can improve accuracy.
- Avoid taking every pattern signal during sideways markets.
- Use proper risk management with every trading setup.
- The indicator can be used for forex, stocks, indices, commodities, and cryptocurrencies.









