
The Three PZ Drives Pattern indicator for MT4 automatically identifies bullish and bearish Three Drives harmonic formations directly on the price chart.
It also plots the relevant Fibonacci ratios and marks potential reversal points with clear visual signals, making it easier to recognize a pattern that can otherwise take considerable time to locate manually.
The Three Drives formation is based on specific Fibonacci relationships between consecutive price swings.
Because of this, the tool is most useful for users who already understand harmonic structures and want an efficient way to monitor potential reversal areas across different timeframes.
Why traders use the Three PZ Drives Pattern Indicator
Harmonic patterns can be difficult to identify consistently, particularly when several swing movements are developing at the same time.
The indicator scans price action for qualifying formations and displays the pattern structure on the chart.
Bullish and bearish formations are clearly differentiated, while entry arrows can highlight the point where a completed setup may lead to a reversal.
Fibonacci ratios provide additional information for evaluating whether the formation has developed according to the expected harmonic structure.
For example, on a bullish EURUSD market using the M15 timeframe, a completed bullish Three Drives formation may appear after a sequence of declining swings.
A blue buy arrow near the potential reversal area can provide a signal to examine a long setup, with the recent reversal point offering a logical reference for stop-loss placement.
Download This MT4 Indicator for Free
Indicator Chart Setup
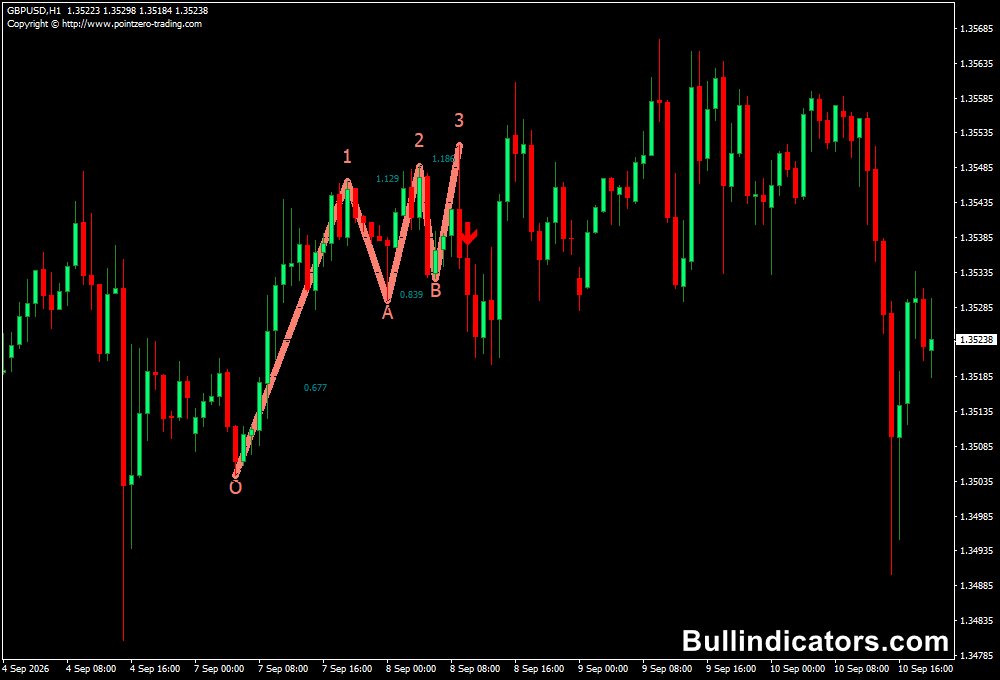
The chart displays the detected Three Drives structure directly over price.
Bullish formations are shown in blue and bearish formations in red.
Fibonacci ratio lines can also be displayed to make the harmonic relationships between the price swings easier to assess.
Buy and sell arrows appear when the relevant pattern reaches its completion criteria.
Labels and ratio information can be customized through the settings, allowing the chart presentation to be adapted to different screen sizes and trading approaches.
Core Features
- Automatic detection of Three Drives harmonic patterns
- Bullish and bearish pattern identification
- Fibonacci ratio calculations displayed on the chart
- Potential buy and sell reversal arrows
- Adjustable pattern size and scanning depth
- Custom colors, labels and ratio lines
- Works across intraday and higher timeframes
Best for
- Finding potential harmonic reversal formations
- Studying Fibonacci-based price structures
- Confirming potential reversal zones with price action
- Monitoring completed bullish and bearish Three Drives setups
Best Markets
- EURUSD and GBPUSD for liquid intraday harmonic setups
- EURJPY and GBPJPY when larger price swings create clear formations
- XAUUSD for users comfortable with wider intraday movements
- Major currency pairs during active London and New York sessions
Trading Styles
- Intraday harmonic trading on M15, M30 and H1
- Swing trading using H4 and D1 formations
- Reversal trading around completed Fibonacci structures
- Multi-timeframe analysis combining higher-timeframe patterns with lower-timeframe entries
How traders use it
A common approach is to wait for the Three Drives formation to reach its final drive before considering an entry.
A bullish pattern can be evaluated for a long position around the projected reversal area, while a bearish formation can be assessed for a short position.
On the example bullish EURUSD M15 setup, the blue formation and Fibonacci relationships identify an area where buyers may regain control.
A buy signal can then be evaluated alongside market structure, momentum and nearby support.
The recent swing low can serve as a reference for risk management, while the next resistance area can help determine a suitable target.
The signals should not be treated as standalone entry instructions.
Strong trends, incomplete formations and sudden volatility can produce setups that fail to reverse, so confirmation remains an important part of the trading process.
Get Instant Free Access
Indicator Settings
- Size of patterns to be found – controls the pattern size.
- Breakout period for arrows – defines the breakout period used for signals.
- Max history bars to evaluate – sets how many historical bars are scanned.
- Color of bullish pattern – controls the bullish pattern color.
- Color of bearish pattern – controls the bearish pattern color.
- Display points – enables or disables point markings.
- Color of bullish label – sets the bullish label color.
- Color of bearish label – sets the bearish label color.
- Label font size – adjusts label text size.
- Display ratios – enables or disables Fibonacci ratio information.
- Label color – controls ratio label coloring.
- Size of ratio lines – adjusts the thickness of the ratio lines.
Important Notes
- Knowledge of harmonic trading and Fibonacci ratios is recommended.
- A completed pattern does not guarantee a market reversal.
- Use price action, market structure or other confirmation before entering a position.
- Risk should be managed with an appropriate stop-loss based on the market structure.
- The tool can be used on intraday, daily, weekly and monthly charts.









