
The Xmaster Formula indicator for MT4 is a popular trend-following tool designed to identify the dominant market direction and highlight potential areas to join an established move.
It combines Moving Averages, RSI and MACD analysis internally, then converts their combined direction into easy-to-read trend dots and BUY or SELL arrows.
This approach can be useful when you want trend information and entry signals without placing several separate technical tools on the chart.
The combination is particularly practical for multi-timeframe analysis, where a higher timeframe establishes the market bias and a lower timeframe provides the entry opportunity.
Why traders use the Xmaster Formula Indicator
The main advantage is its straightforward presentation of trend conditions.
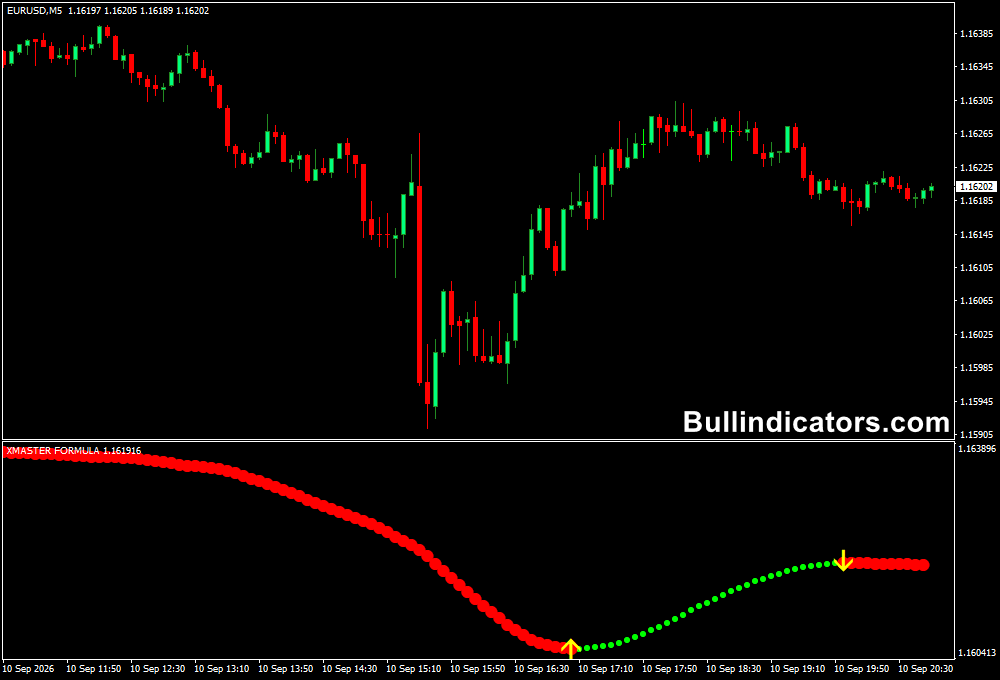
Lime dots indicate bullish conditions, while red dots identify bearish conditions.
Yellow arrows highlight potential areas where price may offer an opportunity to join the prevailing direction.
Because the underlying calculations combine several commonly used technical concepts, the Xmaster Formula can help reduce the need to interpret Moving Averages, RSI and MACD separately.
It is suitable for scalping, intraday trading and swing setups, with H1 and H4 often providing cleaner trend information than very low timeframes.
Download This MT4 Indicator for Free
Indicator Chart Setup
The Xmaster Formula appears in a separate window below the main price chart.
A sequence of lime dots represents bullish market conditions, while red dots indicate bearish conditions. Yellow upward and downward arrows identify potential buy and sell areas.
The separate-window design keeps the candlesticks clear while providing a simple visual representation of trend direction.
For stronger filtering, the signal can be compared with the direction shown on a higher timeframe before an entry is considered.
Core Features
- Trend direction based on Moving Average, RSI and MACD analysis
- Lime bullish and red bearish trend dots
- Yellow BUY and SELL arrows
- Separate display window below the price chart
- Suitable for multi-timeframe analysis
- Works across intraday and higher timeframes
- Email and sound alerts for trading signals
Best for
- Following established market trends
- Finding potential retracement entries
- Filtering short-term setups using higher-timeframe direction
- Trend confirmation alongside support and resistance
Best Markets
- GBPUSD and EURUSD for liquid intraday setups
- USDJPY and EURJPY for directional moves during active sessions
- GBPJPY for traders comfortable with larger price swings
- XAUUSD when combined with suitable volatility and risk controls
Trading Styles
- Scalping on M1 and M5 with higher-timeframe confirmation
- Intraday trading on M15, M30 and H1
- Swing trading using H4 and Daily trend direction
- Trend continuation strategies following market pullbacks
How traders use it
A practical approach is to establish the main direction on H4 or Daily, then move to a lower timeframe for the entry.
The Xmaster Formula provides the trend filter, while a separate entry tool can be used to time shorter-term positions.
GBPUSD M5 Buy Strategy with Ultimate PRO Scalper Indicator
Consider a GBPUSD M5 setup where the higher-timeframe Xmaster Formula shows a bullish trend with persistent lime dots.
The goal is not to chase every upward candle, but to wait for a short-term pullback and look for a fresh buy signal on the M5 chart.
The Ultimate PRO Scalper indicator can be used for this entry timing.
Its green arrow represents a BUY signal, while its red arrow represents a SELL signal.
Buy Entry
- Xmaster Formula shows a bullish direction with lime trend dots on the higher timeframe.
- GBPUSD pulls back on the M5 chart without breaking the broader bullish structure.
- Wait for the Ultimate PRO Scalper to produce a green BUY arrow.
- Confirm that the Xmaster direction remains bullish before entering.
- Place the stop loss below the recent M5 swing low or another logical support level.
- Manage the position toward the next resistance area or a predefined risk-to-reward target.
In one example, GBPUSD produced a bullish M5 setup after a retracement.
The Xmaster Formula maintained its bullish lime trend indication while the Ultimate PRO Scalper generated a green arrow.
The move continued higher and reached a 23-pip gain before the position was closed near the next resistance area.
Sell Entry
- Xmaster Formula shows red dots and confirms a bearish higher-timeframe direction.
- GBPUSD makes a temporary upward retracement on M5.
- Wait for the Ultimate PRO Scalper to print a red SELL arrow as the pullback loses momentum.
- Confirm that the broader Xmaster trend remains bearish.
- Place the stop loss above the recent swing high.
- Consider taking profit near the next support zone or according to the selected risk-to-reward ratio.
This combination gives each tool a separate role: Xmaster Formula establishes the primary trend, while Ultimate PRO Scalper focuses on short-term entry timing.
This can help avoid taking every lower-timeframe signal against the dominant market direction.
Get Instant Free Access
Indicator Settings
- EmailAlert – sends trading signal notifications by email.
- SoundAlert – enables audible alerts when a signal is generated.
Important Notes
- Trend-following signals can perform poorly during sideways or highly choppy markets.
- Wait for the relevant candle to close before acting on a new arrow.
- Higher-timeframe confirmation can help filter weaker M5 and M15 signals.
- Support, resistance and market structure can provide additional confirmation.
- Always use appropriate risk management and a defined stop loss.









