
The Color RSI with Alert indicator for MT4 is a modified version of the classic Relative Strength Index, designed to make momentum shifts easier to identify during live market analysis.
It combines RSI values with color changes, BUY and SELL arrows, and alerts when important conditions are reached.
The result is a practical momentum tool that can help identify potential reversals while also supporting trades taken in the direction of the prevailing trend.
The RSI can be used across short-term and long-term charts, making it suitable for scalping, intraday trading and swing analysis.
It can also be combined with a separate trend tool, such as the Trend Magic Indicator for MT4, to filter signals and focus on setups that agree with the broader market direction.
Why traders use the Color RSI With Alert Indicator
One of the main advantages is that traditional RSI information is presented with additional visual and alert features.
The oscillator changes color according to market conditions, while arrows appear on the price chart when the selected RSI thresholds are reached.
Alerts can also notify traders when a new setup develops.
This makes the tool useful for monitoring several charts without constantly watching each RSI window.
Many traders prefer using the signals as an entry trigger while confirming the overall trend with price action or another trend-following method.
Download This MT4 Indicator for Free
Indicator Chart Setup
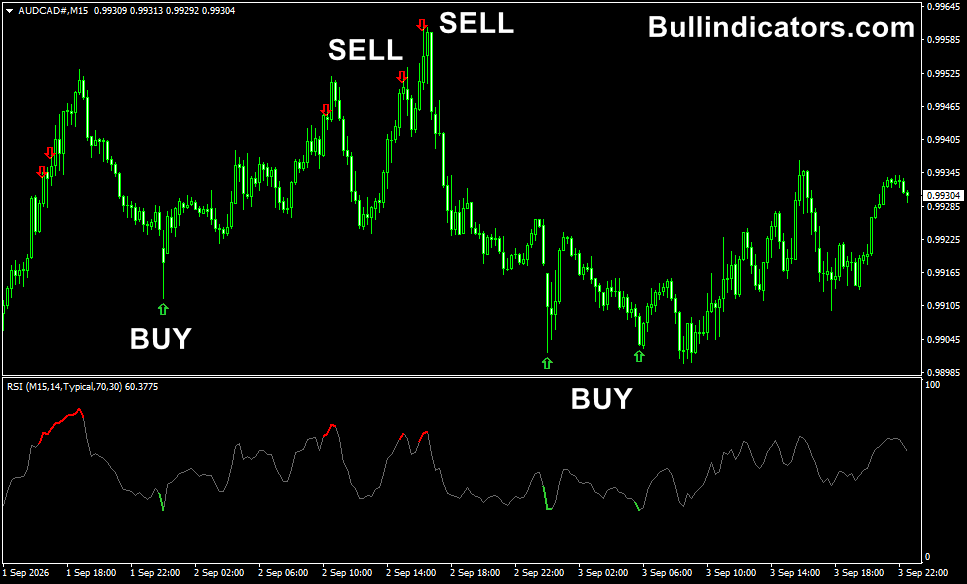
When applied to an MT4 chart, the Color RSI displays its oscillator in a separate window and places BUY or SELL arrows directly on the price chart.
The RSI area uses different colors to distinguish oversold, overbought and neutral conditions.
Green represents the oversold area, red represents overbought conditions, while the middle zone is shown in gray.
For example, on an EURUSD M5 chart, a green BUY arrow following an RSI move below the oversold level can highlight a potential bullish setup.
A red SELL arrow following a move above the overbought level can point to a possible bearish reversal.
Core Features
- BUY and SELL arrows displayed directly on the MT4 price chart.
- Color-changing RSI oscillator for overbought and oversold conditions.
- Price alerts for new RSI signals.
- Adjustable RSI calculation period and price type.
- Selectable timeframe for RSI calculations.
- Works across intraday and higher timeframes.
Best for
- Spotting momentum reversals around RSI extremes.
- Confirming pullbacks within an established trend.
- Finding short-term entry opportunities on lower timeframes.
- Top-down analysis between higher and lower charts.
Best Markets
- EURUSD and GBPUSD for liquid London and New York session setups.
- EURJPY and GBPJPY when stronger intraday movements provide larger reversal opportunities.
- XAUUSD for traders looking for momentum shifts during active US sessions.
- Major indices such as US30 and NAS100 can also provide useful signals when volatility is elevated.
Trading Styles
- Scalping on M1, M5 and M15 charts.
- Intraday trading on M15, M30 and H1.
- Swing trading using H4 and Daily charts.
- Trend-following pullback strategies with confirmation from a separate trend filter.
How traders use it
A common approach is to trade signals that agree with the main trend.
For example, when the Trend Magic line is blue, the market is considered bullish.
When it turns red, the prevailing direction is bearish.
Combining this trend direction with Color RSI signals can help reduce trades taken against strong momentum.
How to Buy
- Confirm that the Trend Magic line is blue, indicating bullish conditions.
- Wait for the Color RSI to enter or move through the oversold zone.
- Look for a green BUY arrow or bullish RSI signal.
- Enter after confirmation from the candle or price action.
- Place the stop loss below a recent swing low.
- Consider taking profit at a minimum 1:2 risk-to-reward ratio or when momentum starts weakening.
How to Sell
- Confirm that the Trend Magic line is red, indicating bearish conditions.
- Wait for RSI to reach or move through the overbought zone.
- Look for a red SELL arrow or bearish RSI signal.
- Confirm the setup with the price action before entering.
- Place the stop loss above a recent swing high.
- Take profit at a suitable resistance area, opposite signal or predefined risk-to-reward target.
Example M5 EURUSD
For example, an EURUSD M5 setup can combine a blue Trend Magic line with a Color RSI BUY signal during an upward move.
Traders who consistently focus on the main direction can potentially capture substantial intraday moves; in strong trends, some setups may produce 50, 100 or even 250+ pips over a series of trades.
These results are market-dependent and should not be treated as guaranteed returns.
Get Instant Free Access
Indicator Settings
- RSIPeriod: Sets the period used for the RSI calculation.
- PriceType: Selects the candlestick price type used in the RSI calculation.
- TimeFrame: Determines the timeframe used for calculating the RSI values.
- overBought: Defines the overbought threshold.
- overSold: Defines the oversold threshold.
- Colors: Controls the visual colors used by the oscillator and signals.
- Alerts: Controls the available alert notifications.
Important Notes
- The arrows identify potential setups but should not be treated as guaranteed entry signals.
- Signals against a strong trend can fail quickly, particularly during high-volatility sessions.
- Combining RSI signals with the main market direction can improve trade selection.
- Use swing highs and lows to position stops rather than placing them at arbitrary distances.
- Always consider spread, volatility and the trading session when evaluating a signal.









