
The Market Profile indicator for MetaTrader 4 maps the distribution of market activity across different price levels, helping you see where the market has spent significant time and where important trading interest has developed.
Rather than focusing only on the direction of individual candles, it organizes price activity into a profile that can highlight areas of acceptance, rejection and concentration.
One of its key elements is the Point of Control (POC), represented by the highest point of the daily histogram.
This level can become an important reference during the following trading sessions, particularly when price approaches it from above or below.
The tool can be applied to intraday charts as well as daily, weekly and monthly timeframes, although the profile itself is calculated on a daily basis.
Why traders use the Market Profile Indicator
The main advantage is the ability to identify important price areas without manually studying every previous session.
High-activity zones can act as potential support or resistance, while thinner areas of the profile may mark prices that the market moved through relatively quickly.
The POC is especially useful for intraday planning.
When yesterday’s POC remains close to current price, it can become a decision point for continuation or rejection.
This makes the tool useful for breakout traders, trend-following approaches and reversal setups.
Download This MT4 Indicator for Free
Indicator Chart Setup
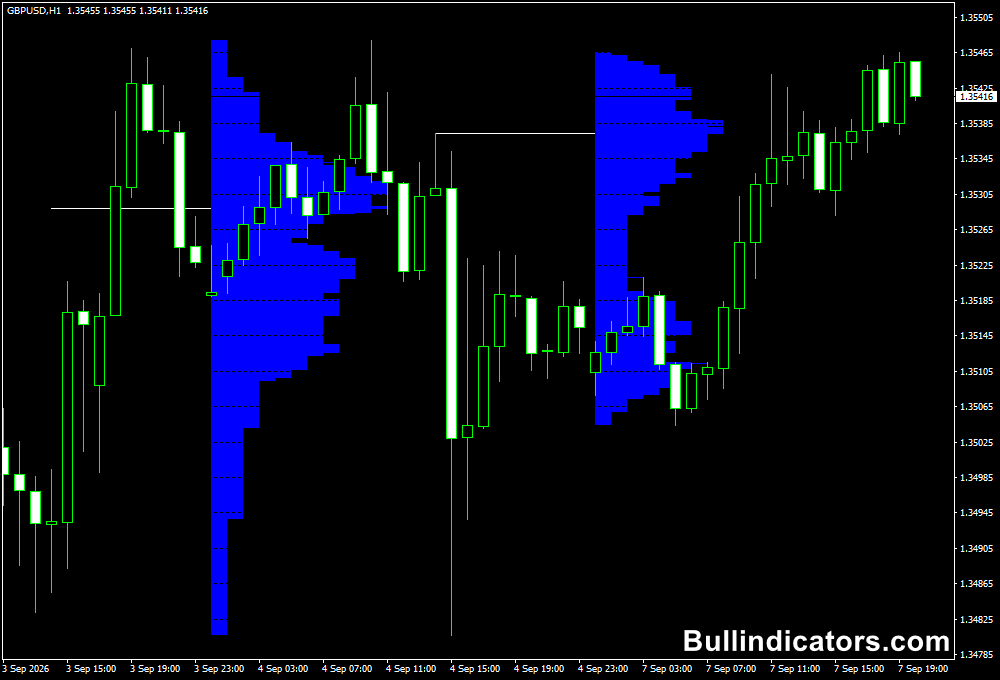
The GBPUSD H1 example shows the Market Profile displayed alongside the price chart.
Blue histogram bars represent the distribution of market activity at different price levels, while the white line marks the Point of Control for the relevant daily profile.
Each trading day forms its own profile, allowing the previous session’s important levels to remain useful during the next session.
The relationship between current price, the POC and the surrounding profile can provide valuable context before an entry is considered.
Core Features
- Daily market profile displayed directly on the MT4 chart.
- Point of Control highlighting the highest activity price level.
- Price distribution shown through a visual histogram.
- Previous session POC available as a potential support or resistance reference.
- Useful for studying accumulation, distribution and directional expansion.
- Works across intraday and higher timeframe charts.
Best for
- Locating high-interest price levels before entering a position.
- Identifying potential reversal and breakout areas.
- Using previous-day levels for intraday trade planning.
- Assessing whether price is accepting or rejecting a specific zone.
- Combining market profile levels with price action and trend analysis.
Best Markets
- EURUSD and GBPUSD for liquid London and New York session trading.
- GBPJPY and EURJPY when larger intraday ranges are preferred.
- Gold (XAUUSD), particularly around active New York sessions.
- US30 and NAS100 for traders focusing on strong intraday movement.
- Other liquid forex pairs where previous-session levels remain relevant.
Trading Styles
- Day trading based on previous-session POC levels.
- Breakout trading when price leaves a high-activity zone.
- Reversal trading around important profile boundaries.
- Trend continuation strategies using POC as a confirmation level.
- Multi-timeframe analysis combining H1 or H4 context with lower-timeframe entries.
How traders use it
A common approach begins with the previous day’s Point of Control.
When price moves above the POC and holds there, the level can become a bullish reference.
A move back below it can suggest weakening demand.
The same principle applies in reverse when price trades below the POC.
For day trading, the profile can also be combined with market structure and candlestick confirmation.
A break through the POC followed by a successful retest can provide a more controlled entry than chasing the initial move.
- Mark the previous day’s POC before the active trading session begins.
- Wait for price to approach or cross the POC rather than entering in the middle of the range.
- For a long setup, look for price to move above the POC, hold the level and produce bullish price action. A stop can be placed below the latest intraday swing low.
- For a short setup, watch for rejection below the POC or a failed recovery above it. A stop can be positioned above the recent swing high.
- Use the opposite side of the day’s developing range or another significant profile level as a potential profit target.
- During strong trends, look for POC retests that support continuation rather than automatically treating every level as a reversal.
Get Instant Free Access
Indicator Settings
- Profile calculation parameters, where available, control how the daily profile is generated.
- Display options can determine how the histogram and Point of Control are shown on the chart.
- Timeframe selection determines the price chart on which the profile is viewed, while the core histogram is calculated from daily activity.
Important Notes
- The Market Profile should be used as a market-location tool rather than a standalone entry system.
- A Point of Control is a reference level, not a guaranteed reversal point.
- Higher activity around a price does not automatically indicate bullish or bearish direction.
- Price action, volatility and session timing can improve the quality of signals around profile levels.
- Risk should be controlled with predefined stop-loss placement and appropriate position sizing.









