
The Hull Moving Average Arrows indicator for MetaTrader 4 combines trend direction, entry arrows and dynamic support/resistance levels in one chart-based tool.
It is built around the Hull Moving Average (HMA), which reacts faster to price changes than many traditional moving averages while maintaining a smoother line.
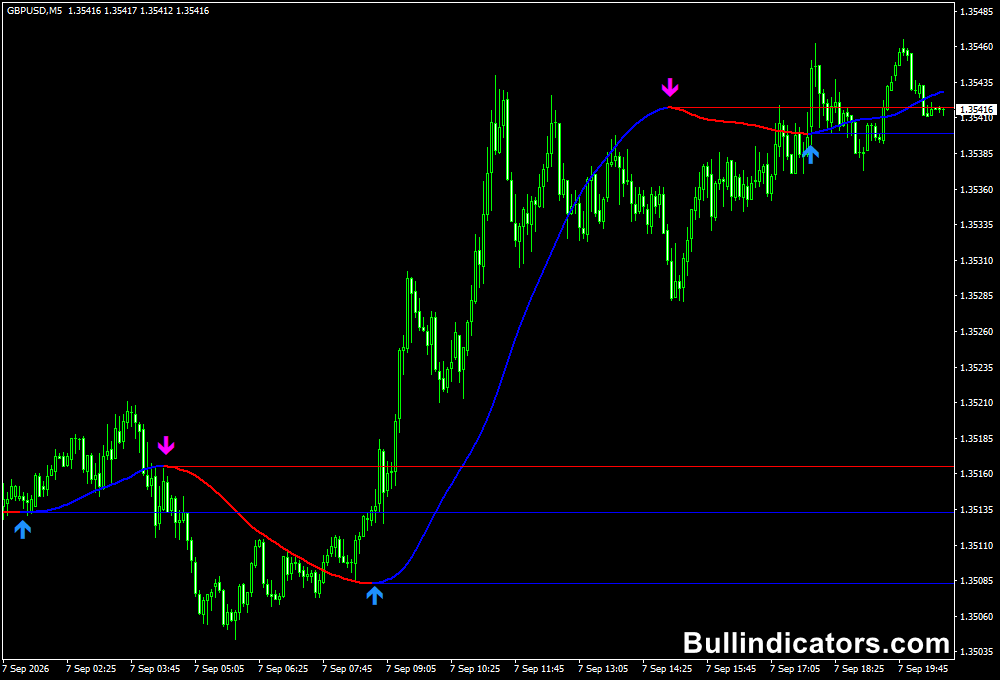
The HMA changes color according to the prevailing direction, while buy and sell arrows highlight potential trading points.
Support and resistance lines are also displayed around price, giving traders additional reference levels for managing entries, stop losses and profit targets.
The setup can be used for scalping, intraday trading and swing strategies across different timeframes.
Why traders use the Hull Moving Average Arrows Indicator
A major advantage of the HMA approach is its responsiveness.
Conventional moving averages can react slowly when price momentum changes, while the HMA is designed to reduce lag and follow directional moves more closely.
The colored HMA line makes it easier to recognize whether bullish or bearish momentum is developing.
The arrows provide additional entry signals, but they are most useful when combined with price action, market structure or another trend filter.
The built-in support and resistance levels can also help determine where a position may encounter opposing pressure.
Download This MT4 Indicator for Free
Indicator Chart Setup
Once running on an MT4 chart, the HMA follows price and changes color as the calculated trend direction changes.
Buy and sell arrows appear when the configured conditions generate a directional signal.
Depending on the settings, horizontal support and resistance lines can also be displayed.
For example, on an M5 GBPUSD chart, a sell arrow appearing near a previous rejection or supply area can provide stronger confluence than the arrow alone.
The same principle can be applied to bullish setups around demand or established support.
Core Features
- Fast-reacting Hull Moving Average for trend analysis.
- Colored HMA line for bullish and bearish market direction.
- Buy and sell arrows for potential trade entries.
- Dynamic support and resistance lines.
- Adjustable HMA period, price and sensitivity.
- Compatible with multiple MT4 timeframes and markets.
Best for
- Identifying directional moves and momentum changes.
- Finding pullback entries within an established trend.
- Scalping on lower timeframes when combined with price action.
- Intraday setups on M15, M30 and H1 charts.
- Building moving-average crossover strategies.
Best Markets
- EURUSD and GBPUSD for liquid intraday setups.
- GBPJPY and EURJPY when stronger price movement is preferred.
- Gold (XAUUSD) for momentum and breakout opportunities.
- Major stock indices such as US30 and NAS100.
- Other liquid instruments where directional movement is pronounced.
Trading Styles
- Scalping with fast HMA settings on M1 and M5.
- Day trading using M15 through H1 trend signals.
- Swing trading with longer HMA periods on H4 charts.
- Trend-following and moving-average crossover systems.
How traders use it
The strongest applications generally come from combining the HMA signal with another piece of market information.
A simple approach is to wait for the HMA to change direction, then look for an arrow and confirmation from nearby support, resistance, supply or demand.
2 HMA Cross-over system
A particularly useful method is to combine a shorter HMA with a longer HMA to create a crossover system.
The shorter average responds quickly to momentum, while the longer average provides the broader directional filter.
- Gold long example: On XAUUSD M15, use a shorter HMA crossing above a longer HMA as the bullish trigger. Wait for a buy arrow and a pullback holding above support. A hypothetical entry at 2,510 could use a stop loss at 2,501 and a take profit at 2,528.
- Gold short example: If the shorter HMA crosses below the longer HMA, wait for a sell arrow and rejection from resistance. A hypothetical entry at 2,510 could use a stop loss at 2,519 and a take profit at 2,492.
- Trade confirmation: Stronger setups occur when the crossover, arrow and price action point in the same direction.
- Risk management: Stop placement should be based on recent swing highs/lows or nearby market levels rather than the signal alone.
Get Instant Free Access
Indicator Settings
- HMA period: Sets the calculation period of the Hull Moving Average.
- HMA price: Selects the price type used for the trend calculation.
- HMA speed: Controls how sensitively the HMA reacts to price changes.
- Lines visible: Enables or disables the support and resistance lines.
- Lines number: Determines how many support and resistance levels are displayed.
- Color up/down: Sets the colors used for the support and resistance lines.
- Show Arrows: Enables or disables the buy and sell arrows.
Important Notes
- The arrows should not be treated as standalone entry signals.
- Shorter HMA settings produce faster signals but can generate more market noise.
- Longer settings are generally better suited to filtering short-term price fluctuations.
- The HMA crossover method works best when supported by price action and key market levels.
- Stop loss and take profit levels should be adapted to volatility and the instrument being traded.
- Always test the selected settings on historical data and a demo account before using real capital.









