
The FXSSI Trading Sessions indicator for MT5 is a practical market timing tool that highlights the major Forex trading sessions directly on your MetaTrader 5 chart.
Since the Forex market operates 24 hours a day, market activity constantly changes as financial centers around the world open and close.
This indicator makes those changes easy to identify by displaying the Sydney, Tokyo, London, and New York sessions with clearly marked rectangles.
Knowing when a trading session begins or when two sessions overlap helps traders anticipate periods of higher volatility and stronger price movement.
Rather than searching for session opening times manually, the indicator keeps all important market hours visible on the chart, allowing better trade planning and improved market awareness.
Why traders use the FXSSI Trading Sessions Indicator for MT5
Many Forex strategies perform better during periods of increased market participation.
The FXSSI Trading Sessions Indicator helps traders focus on the sessions that typically generate the strongest price movements while avoiding slower periods when momentum is limited.
London and New York remain the most active Forex sessions, while the overlap between these markets often produces significant breakouts, trend continuation, and increased liquidity.
By keeping these sessions visible, traders can align their technical analysis with the times when opportunities are most likely to develop.
Download This MT5 Indicator for Free
Indicator Chart Setup
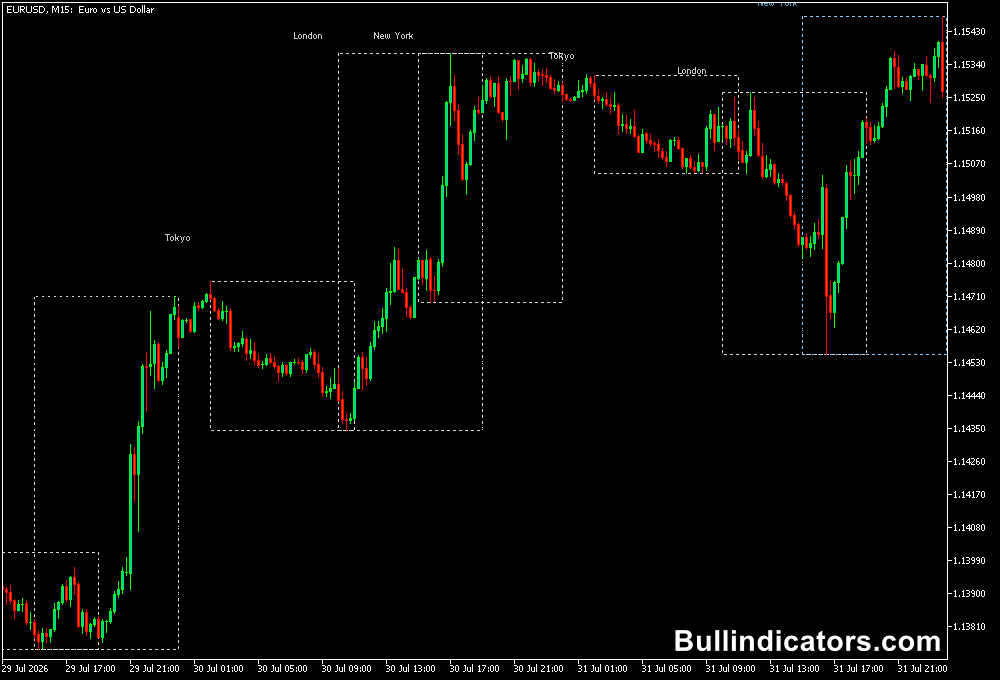
Once attached to a MetaTrader 5 chart, the indicator draws colored rectangles covering each trading session.
The width of every rectangle corresponds to the duration of the session on the selected timeframe, while its height reflects the price range traded during that period.
Each rectangle is labeled with the session abbreviation, making it easy to distinguish between Sydney, Tokyo, London, and New York trading hours.
The indicator also displays both previous sessions and upcoming ones, allowing traders to prepare for the next period of market activity.
Core Features
- Displays Sydney, Tokyo, London, and New York trading sessions.
- Shows both historical and upcoming trading sessions.
- Automatically adjusts session size to the selected timeframe.
- Highlights session overlaps where volatility often increases.
- Customizable session visibility and display settings.
- Supports server time offset adjustment.
Best for
- Finding the most active periods of the trading day.
- Planning breakout and momentum-based strategies.
- Improving entry timing around major market openings.
- Avoiding low-volume periods with limited price movement.
- Combining market timing with technical indicators.
Best Markets
- Major Forex pairs: EURUSD, GBPUSD, USDJPY, and USDCHF during London and New York sessions when liquidity is highest.
- EUR and GBP crosses: Strong candidates during the European session due to increased institutional participation.
- JPY pairs: USDJPY, EURJPY, and GBPJPY around the Tokyo session and the transition into London trading.
- Gold (XAUUSD): Often shows increased volatility during the London open and US market hours.
- US indices: NASDAQ, S&P 500, and Dow Jones during the New York session when equity markets open.
Trading Styles
- Forex scalping on M5 and M15 charts during London session activity.
- Intraday trend trading on M30 and H1 timeframes.
- Breakout strategies around London and New York session openings.
- Momentum trading on major currency pairs during session overlaps.
- Higher timeframe market analysis using H4 charts.
How traders use it
The FXSSI Trading Sessions Indicator does not create automatic entry signals.
Its main purpose is to provide market timing information that can improve the execution of existing trading methods.
A common approach is combining this indicator with a trend confirmation tool such as the MACD 4C Indicator for MT5.
When the MACD histogram is green and positioned above the zero line, it suggests bullish momentum.
A red histogram below the zero line indicates bearish market conditions.
After identifying the trend direction, traders can use the FXSSI Trading Sessions Indicator to wait for higher-volume periods.
For example, a bullish setup may receive additional confirmation when a London or New York session begins while the MACD shows positive momentum.
Bearish setups can be evaluated in the same way when the histogram confirms downward pressure.
This combination helps create a more disciplined approach by matching technical signals with periods when the market is typically more active.
Get Instant Free Access
Indicator Settings
- Session Options – Enable or disable specific trading sessions displayed on the chart.
- Short Name Length – Adjust the length of session abbreviations.
- Server Time Offset – Modify the indicator time zone according to broker server time.
- Fill Sessions Background – Turn session rectangle background filling on or off.
- Past Sessions to Show – Select how many previous sessions remain visible.
- Future Sessions to Show – Choose the number of upcoming sessions displayed.
Important Notes
- The indicator is designed mainly for M30 timeframes and above.
- Higher timeframes show a simplified session representation due to fewer visible candles.
- London and New York sessions generally provide the strongest market activity.
- The indicator should be combined with technical analysis for trade decisions.
- Use proper stop-loss placement and risk management with every strategy.









