
The MACD 2 Lines indicator for MT5 is an enhanced version of the traditional MACD oscillator, designed to provide a clearer view of momentum shifts and trend changes.
By combining a colored moving average cloud with a multi-colored histogram, the indicator helps traders identify bullish and bearish market conditions more efficiently.
It transforms the standard MACD analysis into a more visual approach, allowing traders to recognize possible entry opportunities and changes in momentum faster.
Why traders use the MACD 2 Lines Indicator
The traditional MACD is widely used by traders, but fast-changing markets can sometimes make its signals difficult to interpret.
The MACD 2 Lines indicator improves the original concept by adding additional visual information that highlights the relationship between the fast and slow moving averages.
The colored cloud shows whether short-term momentum is strengthening or weakening, while the histogram separates positive and negative market pressure through different colors.
This makes it easier to identify when buyers or sellers are gaining control.
Currency traders can use the indicator as part of a complete trading system or as confirmation alongside trendlines, support and resistance, and other technical tools.
Download This MT5 Indicator for Free
Indicator Chart Setup
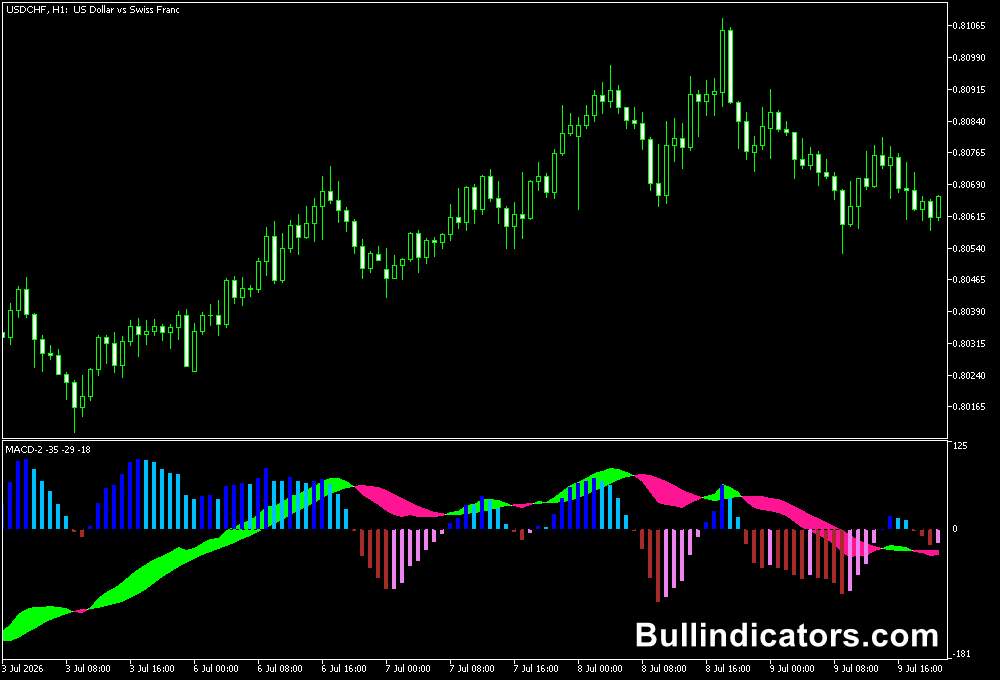
After attaching the indicator, a MACD-based analysis window appears with a colored histogram and a visual moving average cloud.
The cloud changes color when the relationship between the fast and slow moving averages shifts, highlighting possible momentum changes.
The histogram uses multiple colors to separate bullish and bearish pressure, helping traders quickly evaluate whether buying or selling conditions are developing.
Core Features
- Enhanced version of the standard MACD oscillator.
- Displays a colored fast and slow EMA cloud.
- Uses multiple histogram colors to identify market pressure.
- Highlights potential trend changes visually.
- Suitable for different trading approaches and timeframes.
- Works as both a signal tool and trend confirmation indicator.
Best for
- Momentum analysis.
- Trend confirmation.
- Identifying possible entry points.
- Spotting changes in market direction.
- Combining with technical trading systems.
Best Markets
- Currency pairs with strong directional moves where momentum shifts are easier to identify.
- Gold and silver, which often produce extended trends after volatility increases.
- Major stock indices with clear bullish and bearish cycles.
- Liquid cryptocurrency markets where momentum indicators can highlight strong moves.
- Markets that respond well to moving average and trend-based analysis.
Trading Styles
- Scalping.
- Intraday trading.
- Swing trading.
- Trend following.
- Momentum trading.
How traders use it
Traders commonly use the MACD 2 Lines Indicator by combining the histogram direction with the color of the moving average cloud.
Bullish conditions are generally considered when the cloud turns positive and histogram bars show buying momentum.
Bearish conditions appear when the cloud changes lower and selling pressure dominates.
For example, during an uptrend, traders may wait for bullish histogram colors and a positive cloud change before entering a buy position.
During a downtrend, the opposite conditions can be used to search for short opportunities.
Many users also use trendlines or support and resistance levels to filter signals and improve timing.
Get Instant Free Access
Indicator Settings
- FastMACD – Defines the period of the fast moving average used in the MACD calculation.
- SlowMACD – Sets the period of the slower moving average used to measure broader momentum.
- SignalMACD – Adjusts the signal moving average period that influences the indicator response.
- PriceMACD – Selects which price value is used for calculations, including open, high, low, or close price.
Important Notes
- The indicator should be used as a confirmation tool rather than relying on signals alone.
- Shorter settings may generate faster signals but can also increase market noise.
- Longer settings can provide smoother readings for larger market trends.
- MACD signals are generally stronger when they agree with the overall market direction.
- Combining momentum analysis with price action can improve trade selection.









